
22/03/2024
Will the Magnificent 7 continue to set the pace in the market?
In 2023, the Magnificent 7 shaped stock market performance
-
USD 13.2 trillion
Market capitalisation of the Magnificent 7. Equivalent to the nominal GDP of the six largest Eurozone economies1
Source: Bloomberg and Santander
-
30%
Market capitalisation of these seven companies with respect to the capitalisation of the S&P 500 (18% of the MSCI World) Source: Bloomberg and Santander
-
5x
The market expects Nvidia's revenuesto increase 5-fold (and earnings 7-fold) in 2022-2026 Source: Factset, combined with analysts' estimates. Data as of 28/2/2024
The Magnificent 7 are companies with a world-leading position in technologythat has enabled them to outstrip market growth, and they are leading the artificial intelligenceboom. They are Microsoft, Apple, Nvidia, Amazon, Alphabet, Meta and Tesla.
Equities performed exceptionally well in 2023, but much of this appreciation was due to the performance of the Magnificent 7 — three tech companies (Apple, Microsoft, Nvidia), two communications companies (Meta and Alphabet) and two in the consumer discretionary sector (Amazon and Tesla). This appreciation was supported by their dominant position in high-margin segments of the economy, and by their outstanding lead in artificial intelligence.
The Magnificent 7 appreciated by 91% in aggregate (weighted by market capitalisation) compared with 24% by the S&P 500 index and 12% by the other 493 components of the index. Nevertheless, as shown in the above chart, there was significant dispersion within that appreciation (Nvidia appreciated by 5 times more than Apple).
Global companies that are as big as European economies and are gaining in weight in the indexes.
The market capitalisation of Microsoft (USD 3 trillion) or Apple (USD 2.8 trillion) is similar in size to the economy of France (USD3.1 trillion) or the United Kingdom (USD 3.3 trillion)*. The Magnificent 7 currently represent 18% of the MSCI World index, 30% of the S&P 500 and 40% of the Nasdaq 100. This concentration has doubled in the last five years, particularly since the pandemic. According to Goldman Sachs**, such a high level of concentration in the seven largest companies in the index is unprecedented (you can find the detail in the factsheet attached at the bottom of the page).
*IMF World Economic Outlook Database. October 2023.
** 2024 US Equity Outlook: “All You Had To Do Was Stay”. Goldman Sachs. 15 Nov 2023.
What's behind these companies' growth?
They share certain strengths that constitute a barrier to entry into their respective markets — what is called an “economic moat”. This term was coined by Warren Buffet to refer to the competitive advantages that a company has been able to establish in its industry. This is what has enabled these companies to generate above-average growth, margins and earnings and is the key to their extraordinary share performance.
-

Strong brands
-

Digital ecosystems
-

Sound financial position
-

Data & Analysis
-

Innovation
-

Talent
-

Scalability
Differences are evident in the 2023 fourth quarter results
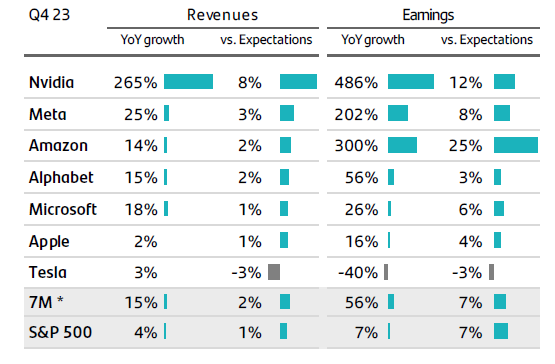
As can be seen in the table, Nvidia, Meta and Amazon have exceeded market expectations. Alphabet, Microsoft and Apple are performing in line with expectations, while Tesla has failed to meet expectations in terms of both revenuesand earnings.
Source: Bloomber. Data as of 27/2/2024* Weighted by market capitalisation
Can the Magnificent 7 continue to grow sustainably in the long term?
To attempt an answer to this question, we will analyse two variables: valuation and expected long-term growth, as well as their positioning in the artificial intelligence race.
1. Valuation. For a company's valuation to be sustainable over time, price growth must be supported by above-average earnings growth. The PEG (Price/Earnings-to-Growth) ratio compares the share price, relative to the company's earnings (price/earnings or P/E), with its expected future growth. A low PEG ratio suggests that the company is undervalued relative to its earnings potential. Conversely, a high level suggests it is overvalued.
2. Positioning in the artificial intelligence race. Artificial intelligence (AI) is a disruptive technology that is expected to be the main driver this decade. It is vital to form part of the AI value chain.The key to positioning in AI lies in a combination of strengths in data, infrastructure (GPUs and cloud) and models.
These seven companies in aggregate (viewed together and not individually)will not outperform in 2024 in the same way as they did in 2023. Their high valuations set a high bar in terms of maintaining the earnings growth differential, preserving the moat in key segments and convincing the market of their superior position in AI.

Related articles

Important Legal Information
This document has been prepared by Banco Santander, S.A. ("Santander") for information purposes only and is not intended to be, and should not be construed as, investment advice, a prospectus or other similar information material.
This material contains information compiled from a variety of sources, including business, statistical, marketing, economic and other sources. The information contained in this material may also have been compiled from third parties, and this information may not have been verified by Santander and Santander accepts no responsibility for such information.
Any opinion expressed in this document may differ from or contradict opinions expressed by other members of Santander. Any third-party materials (including logos and trademarks), whether textual (articles / studies / reports / etc. or excerpts thereof) or graphic (photos / graphics / drawings / etc.), contained in this report / publication are copyright their respective owners and are reproduced only in accordance with industrial or commercial fair use.
The information contained in this material is of a general nature and is provided for illustrative purposes only. It does not relate to any specific jurisdiction and is in no way applicable to specific situations or individuals. The information contained in this document is not an exhaustive and formal analysis of the issues discussed and does not establish an interpretative or value judgement as to their scope, application or feasibility. Although the information contained in this document has been obtained from sources that Santander believes to be reliable, its accuracy or completeness is not guaranteed. Santander assumes no responsibility for the use made of the information contained herein.