

20/09/2023
Emerging Markets Debt: an alternative to diversify portfolios
Why emerging markets debt and why now?
Based on their historical experience, emerging countries' central banks understood very quickly that the inflation surge was not "transitory".As a result, major countries in this bloc began an early hiking cycle, with Brazil and Russia leading the way in the first quarter of 2021, followed by Mexico, Chile, Poland and South Africa, several quarters ahead of their developed country counterparts.
-
23.7%
Weight of emerging markets debt within global fixed-income markets1
Source: SIFMA. End 2022. -
~8%
Average Yield to Worst on the asset over the last 18 months2
Source: Bloomberg, J.P. Morgan EMBI Global Core Yield to Worst. Data as of 11/08/2023 -
2.7%
Emerging markets vs. developed markets growth differential at a 10-year high3
Source: International Monetary Fund. World Economic Outlook July 2023.
1. Early action by central banks
Based on their historical experience, emerging countries' central banks understood very quickly that the inflation surge was not "transitory". As a result, major countries in this bloc began an early upward cycle, with Brazil and Russia leading the way in the first quarter of 2021, followed by Mexico, Chile, Poland and South Africa, several quarters ahead of their developed country counterparts.
2. Better fundamentals in EM vs. DM favour emerging currencies vs. the US dollar
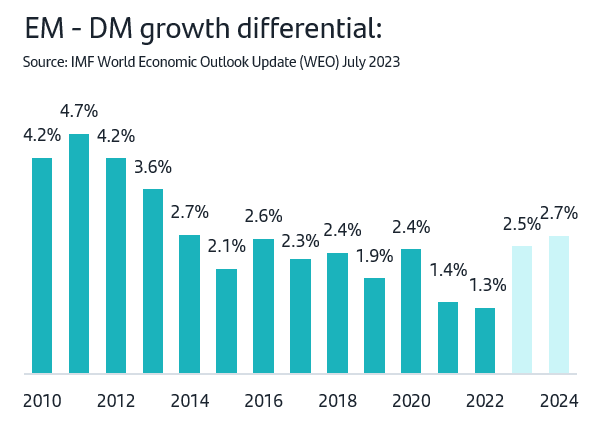
Higher 10-year growth differential
According to data from the International Monetary Fund (IMF) in its July 2023 World Economic Outlook, growth in developed economies (DM) is expected to slow from 2.2% in 2022 to 1.5% in 2023 and 1.4% in 2024. Emerging economies (EM), meanwhile, are expected to grow by 4.0% in 2023 and 4.1% in 2024, up from 4.0% in 2022. The growth differential is at its highest in a decade. The shift towards a more accommodative monetary policy that has already begun in some emerging economies (Brazil, Chile, China) favours growth.
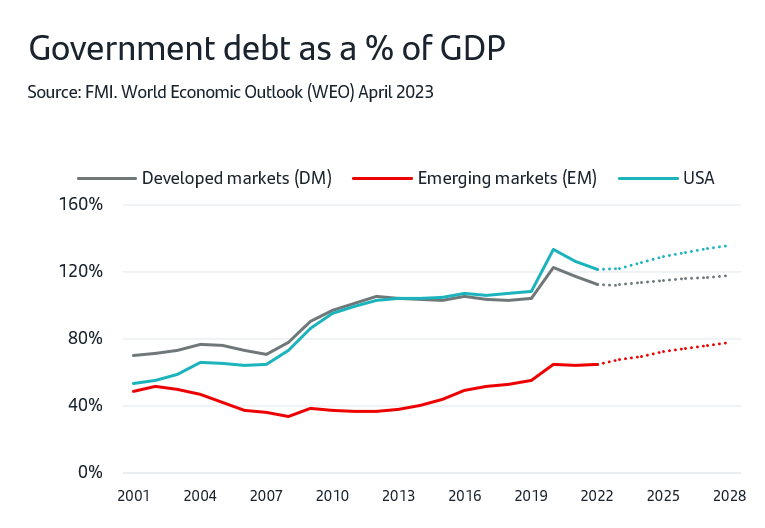
Lower debt, better fiscal position
Rising interest rates also increase the burden of debt interest payments and make the fiscal situation of these countries, especially the United States, more complex than in emerging countries, where government debt is 65% of GDP (compared with 120% in the US).
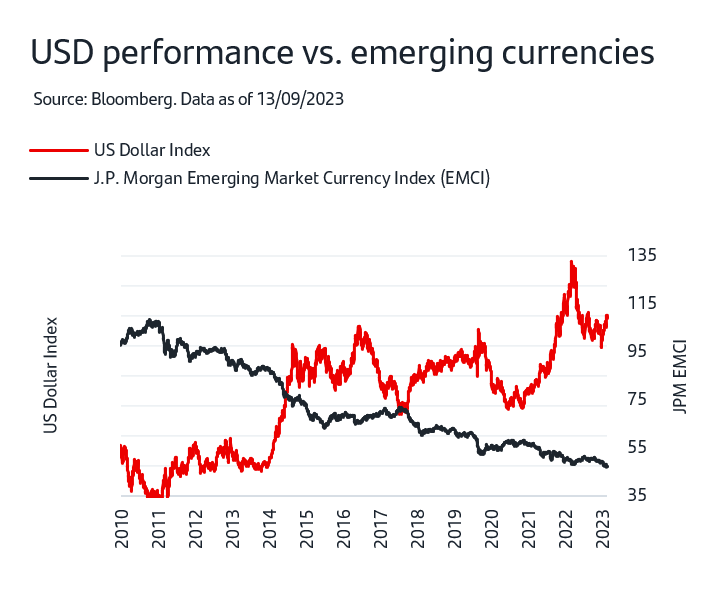
Better prospects for emerging currencies compared with the US dollar
As shown in the right-hand chart, the Dollar Index, which measures the value of the US dollar relative to a basket of foreign currencies, peaked in the second half of 2022 and has been depreciating ever since. In contrast, emerging currencies are currently quite undervalued (EMCI Index in the chart). Given better growth expectations and a fairly healthy fiscal position compared to the United States, they are expected to appreciate against the USD in the short term.
3. An important and growing asset class
The fixed-income market has grown strongly over the last 15 years, having almost doubled in size (1.8x). Much of this growth is due to emerging market debt, led by China, which has increased 9-fold.
As a result, emerging debt grew from 4.8% of the global fixed-income market in 2008 to 23.7% at the end of 2022.
4. Risk-Reward
The emerging fixed-income market can be divided into three asset classes: (i) hard currency (HC) government debt, i.e. in USD or EUR, (ii) local currency government debt, and (iii) corporate debt (generally issued in HC). Local currency debt is the largest segment and it is also the one with the greatest volatility due to currency fluctuations. This historical headwind seems unlikely to have a major influence in the coming quarters, which makes this asset class more attractive.
It is important to note that the three asset classes are mutually complementary as each offers exposure to a different type of issuer with different risk features. Which one is more advisable depends on the situation in the cycle.

Related articles


Important Legal Information
This document has been prepared by Banco Santander, S.A. ("Santander") for information purposes only and is not intended to be, and should not be construed as, investment advice, a prospectus or other similar information material. This material contains information compiled from a variety of sources, including business, statistical, marketing, economic and other sources. The information contained in this material may also have been compiled from third parties, and this information may not have been verified by Santander and Santander accepts no responsibility for such information. Any opinion expressed in this document may differ from or contradict opinions expressed by other members of Santander. The information contained in this material is of a general nature and is provided for illustrative purposes only. It does not relate to any specific jurisdiction and is in no way applicable to specific situations or individuals. The information contained in this document is not an exhaustive and formal analysis of the issues discussed and does not establish an interpretative or value judgement as to their scope, application or feasibility. Although the information contained in this document has been obtained from sources that Santander believes to be reliable, its accuracy or completeness is not guaranteed. Santander assumes no responsibility for the use made of the information contained herein.